

Trade spend effectiveness is a vital concern for companies in the CPG industry, yet it remains challenging to measure directly. This blog will, therefore, focus on five key performance indicators (KPIs) that provide the most significant insights into trade spend effectiveness. By tracking these KPIs, CPG companies can gain a clearer understanding of how their trade spend impacts overall performance and profitability.
Understanding trade spend effectiveness
Trade spend in the context of consumer-packaged goods (CPG) refers to the funds allocated by manufacturers to promote and sell their products through various channels such as retailers, wholesalers, and distributors. It encompasses a range of activities aimed at enhancing product availability, visibility, and accessibility to consumers. This can include promotions, non-promoted discounts, long-term investments, and contractual agreements.
Measuring trade spend effectiveness
Measuring the effectiveness of trade spending is a complex task due to several factors:
1. Data accuracy and timeliness:
The accuracy of trade spend data is often questionable. Because the sheer volume of data and the variety of sources can make it difficult to obtain a detailed, integrated view. Additionally, reports are typically generated monthly, which may not be frequent enough to adjust plans in a timely manner.
2. Multiple variables:
Sales are influenced by many factors beyond trade spend, such as pricing, seasonality, competitive actions, consumer behavior, and macroeconomic factors. Disentangling these effects to isolate the impact of trade spend is a significant challenge.
3. Lagged effects:
The effects of trade promotions may not be immediate but can spread over time, leading to lagged effects on sales. This delay complicates the direct measurement and attribution of trade spend effectiveness.
4. Data granularity and integration issues:
Integrating data from different sources, such as sales, marketing, and retailer data, is often problematic. This is due to varying formats, systems, and levels of detail. Data may also be available only at an aggregate level, which can impede a thorough trade spend analysis.
5. Attribution challenges:
It is difficult to accurately attribute sales increases to specific trade investments. For starters, because promotions can vary widely across regions, stores, and products. This makes it challenging to isolate the impact of particular trade spend activities. These activities also often coincide with other marketing efforts, further complicating the isolation of trade spend effects.
6. Retailer influence:
Retailer-driven factors, such as their own promotions, shelf placement, and pricing strategies, have a significant impact on sales. These factors, often outside the manufacturer’s control, add another layer of complexity to measuring trade spend effectiveness.
In summary, the complexity of measuring trade spend effectiveness in the CPG industry arises from the intricate interplay of multiple influencing factors. Furthermore, there are data challenges and the difficulty in isolating specific effects, which collectively render direct measurement a formidable task.
it’s crucial to recognize that no single KPI can provide a complete picture of trade spend effectiveness. Therefore, utilizing a comprehensive set of KPIs is necessary to accurately evaluate performance and inform strategic decisions. This multi-dimensional approach ensures a more nuanced understanding and effective management of trade spend.
Top 5 KPIs for measuring trade spend effectiveness
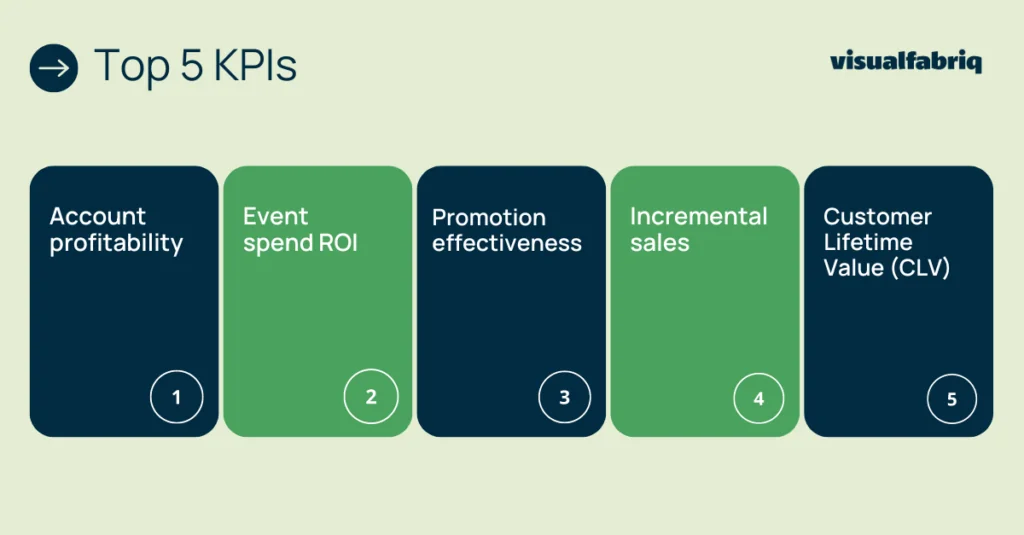
1. Account profitability:
Definition: The net profit generated from each account after deducting trade spend and other related expenses.
Importance: Highlights which accounts are most beneficial to the company’s bottom line, guiding better allocation of resources.
Metrics to track: Key metrics such as gross margin, net profit, and return on investment (ROI) per account.
Example: Analyzing the profitability of a key retail partner to ascertain if the trade spend is generating adequate returns.
2. Event spend ROI:
Definition: The return on investment from non-promoted activities, such as in-store tastings or displays without discounts.
Importance: Offers a tangible measure of the financial return from event spend, ensuring that investments are judicious.
Metrics to track: The incremental revenue from event spend divided by the total event spend.
Example: Evaluating the ROI of additional facings to determine the effectiveness in increasing sales.
3. Promotion effectiveness:
Definition: The influence of promotional activities on sales and customer engagement.
Importance: Identifies which promotions are most effective at driving sales and are worth replicating.
Metrics to track: Metrics include sales uplift during promotions, promotion ROI, and customer acquisition rates.
Example: Measuring the sales boost from a buy-one-get-one-free promotion to decide if similar offers should be conducted in the future.
4. Incremental sales:
Definition: The extra sales generated directly as a result of trade promotions or non-promoted initiatives, such as incremental sales from a product listing.
Importance: Distinguishes the impact of trade spend from natural sales growth.
Metrics to track: Comparison of baseline sales against sales during promotional periods, and the percentage increase in sales attributable to promotions. Don’t forget to account for own-product cannibalization. This occurs when a promotion for one product size, such as a 500g package, causes customers to switch from purchasing another size, like a 1kg package. This switch often results in a net impact that is marginally lower than the sales of the promoted initiative alone, due to the trade-off between the two product sizes.
Example: Analyzing the sales increase during a new product launch promotion to gauge its effectiveness.
5. Customer Lifetime Value (CLV):
Definition: The total revenue a business expects from a customer throughout their relationship.
Importance: Reflects the long-term effects of trade spend on customer retention and value.
Metrics to track: Average purchase frequency, average order value, and customer retention rate.
Example: Assessing how a loyalty program, influenced by trade spend, enhances the lifetime value of customers.

Trade spend KPI tracking
The accurate tracking of KPIs is pivotal for assessing the effectiveness of trade spend and informing strategic decisions. Utilizing the right technology is crucial in this process, as it ensures precision and reliability in data collection and trade spend analysis. Advanced tools that offer comprehensive data integration, artificial intelligence, and robust reporting capabilities can significantly enhance the accuracy and efficiency of trade spend KPI tracking.
Visualfabriq’s solutions are designed to address these needs effectively. They provide a suite of tools that facilitate comprehensive data integration, allowing for a holistic view of trade spend performance. With the power of AI, Visualfabriq can help predict outcomes and optimize planning. This ensures that each trade spend decision is as informed as possible. Furthermore, the software’s reporting features enable clear visualization of KPIs, making it easier to interpret complex data and draw actionable insights. Additionally, scenario planning tools allow for the exploration of various strategies, helping to optimize trade spend as you plan.
Implementing such technology ensures that the intricate details of trade spend effectiveness are not overlooked; and that strategic decisions are supported by the most accurate and comprehensive data available.
Trade spend analysis: takeaways
As we navigate the complexities of trade spend strategies, it’s essential to leverage the right KPIs to measure and understand their effectiveness. The KPIs outlined in this blog post serve as a comprehensive guide to evaluating the impact of trade spend on various aspects of business performance.
Therefore, we encourage you to integrate this set of KPIs into the analysis of your trade spend effectiveness. Consider the benefits of deploying advanced solutions like Visualfabriq, which can significantly enhance your measurement and analysis capabilities. With features such as comprehensive data integration, AI-driven insights, and scenario planning, Visualfabriq is equipped to help you optimize your trade spend and align it with your business goals.
To see Visualfabriq in action and understand how it can transform your trade spend management, booking a demo is a great next step. It’s an opportunity to witness firsthand the potential of this technology to streamline your processes and provide deep insights into your trade spend effectiveness.
.png)
.png)